Grundläggande statistik
| Institutionella ägare | 267 total, 249 long only, 3 short only, 15 long/short - change of 11 900,00% MRQ |
| Genomsnittlig portföljallokering | 0.3438 % - change of −36,30% MRQ |
| Institutionella aktier (lång) | 153 421 448 (ex 13D/G) - change of 104,59MM shares 49 921,73% MRQ |
| Institutionellt värde (lång) | $ 2 475 162 USD ($1000) |
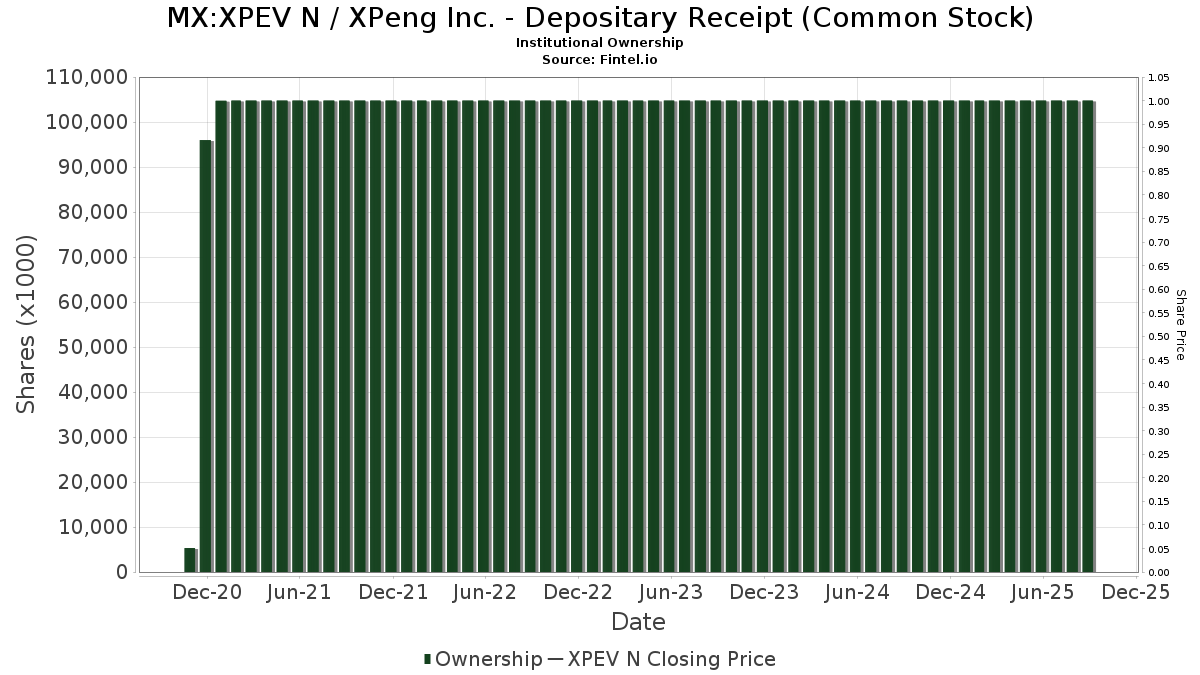
Institutionellt ägande och aktieägare
XPeng Inc. - Depositary Receipt (Common Stock) (MX:XPEV N) har 267 Institutionella ägare och aktieägare som har lämnat in 13D/G- eller 13F-formulär till Securities Exchange Commission (SEC). Dessa institut innehar totalt 155,653,835 aktier. Största aktieägare inkluderar Alibaba Group Holding Ltd, TMT General Partner Ltd, Primecap Management Co/ca/, Morgan Stanley, VHCOX - Vanguard Capital Opportunity Fund Investor Shares, UBS Group AG, Goldman Sachs Group Inc, D. E. Shaw & Co., Inc., Susquehanna International Group, Llp, and Bank Of America Corp /de/ .
XPeng Inc. - Depositary Receipt (Common Stock) (BMV:XPEV N) Institutionell ägarstruktur visar institutioners och fonders nuvarande positioner i företaget, samt de senaste förändringarna i positionernas storlek. Större aktieägare kan vara enskilda investerare, fonder, hedgefonder eller institutioner. Bilaga 13D visar att investeraren äger (eller ägde) mer än 5% av företaget och avser (eller avsåg) att aktivt eftersträva en förändring av affärsstrategin. Schedule 13G indikerar en passiv investering på över 5%.
Fondsentimentets poäng
Fondsentimentet poängen(fka Ägarackumulation-poäng) visar vilka aktier som är mest köpta av fonder. Det är resultatet av en sofistikerad kvantitativ flerfaktormodell som identifierar företag med de högsta nivåerna av institutionell ackumulering. Poängsättningsmodellen använder en kombination av den totala ökningen av redovisade ägare, förändringarna i portföljallokeringarna för dessa ägare och andra mått. Siffran sträcker sig från 0 till 100, där högre siffror indikerar en högre nivå av ackumulering i förhållande till sina konkurrenter, och 50 är genomsnittet.
Uppdateringsfrekvens: Dagligen
Se Ownership Explorer, som innehåller en lista över de högst rankade företagen.
13F- och NPORT-arkiveringar
Detaljer om 13F-arkiveringar är gratis. Detaljer om NP-arkiveringar kräver ett premiummedlemskap. Gröna rader indikerar nya positioner. Röda rader indikerar stängda positioner. Klicka på länk symbolen för att se hela transaktionshistoriken.
Uppgradera
för att låsa upp premiumdata och exportera till Excel ![]() .
.
| Fil Datum | Källa | Investerare | Typ | Genomsnittligt pris (beräknat) |
Aktier | Δ Aktier (%) |
Rapporterat värde (1000 USD) |
Δ Värde (%) |
Portföljallokering (%) |
|
|---|---|---|---|---|---|---|---|---|---|---|
| 2025-08-08 | 13F | Cetera Investment Advisers | 41 257 | 738 | ||||||
| 2025-08-14 | 13F | Millennium Management Llc | Call | 443 000 | 264,91 | 7 921 | 214,91 | |||
| 2025-08-14 | 13F | Balyasny Asset Management Llc | 32 254 | −19,06 | 577 | −30,18 | ||||
| 2025-08-08 | 13F | Cetera Investment Advisers | Put | 17 300 | 56 | |||||
| 2025-08-14 | 13F | Millennium Management Llc | 378 438 | −88,83 | 6 766 | −90,36 | ||||
| 2025-08-14 | 13F | Balyasny Asset Management Llc | Call | 274 600 | 264,67 | 4 910 | 214,68 | |||
| 2025-08-14 | 13F | Millennium Management Llc | Put | 564 800 | −9,75 | 10 099 | −22,12 | |||
| 2025-08-14 | 13F | Balyasny Asset Management Llc | Put | 123 300 | 46,79 | 2 205 | 26,67 | |||
| 2025-07-09 | 13F | Northwest & Ethical Investments L.P. | 0 | −100,00 | 0 | −100,00 | ||||
| 2025-08-14 | 13F | Qube Research & Technologies Ltd | Put | 0 | −100,00 | 0 | −100,00 | |||
| 2025-07-28 | 13F | Private Wealth Asset Management, LLC | 105 | 0,00 | 2 | −50,00 | ||||
| 2025-08-27 | NP | VHCOX - Vanguard Capital Opportunity Fund Investor Shares | 9 075 419 | 2,14 | 162 268 | −11,86 | ||||
| 2025-07-31 | 13F | Caitong International Asset Management Co., Ltd | 120 | 275,00 | 2 | |||||
| 2025-08-07 | 13F | Mitsubishi UFJ Kokusai Asset Management Co., Ltd. | 123 101 | −51,54 | 2 201 | −58,18 | ||||
| 2025-08-15 | 13F | Sender Co & Partners, Inc. | 0 | −100,00 | 0 | −100,00 | ||||
| 2025-08-11 | 13F | Nomura Asset Management Co Ltd | 1 790 | 0,00 | 32 | −13,51 | ||||
| 2025-08-14 | 13F | Man Group plc | 191 603 | −3,19 | 3 426 | −16,46 | ||||
| 2025-08-14 | 13F | SIH Partners, LLLP | 586 166 | 118,28 | 10 481 | 88,35 | ||||
| 2025-07-23 | 13F | Vontobel Holding Ltd. | 42 241 | 254,13 | 755 | 205,67 | ||||
| 2025-08-14 | 13F | Boston Private Wealth Llc | 0 | −100,00 | 0 | −100,00 | ||||
| 2025-08-12 | 13F | Global Retirement Partners, LLC | 186 | 51,22 | 3 | 200,00 | ||||
| 2025-08-12 | 13F | MAI Capital Management | 2 789 | 2 045,38 | 50 | 2 350,00 | ||||
| 2025-08-15 | 13F | CI Private Wealth, LLC | 68 960 | 94,66 | 1 233 | 67,98 | ||||
| 2025-08-13 | 13F | Himension Fund | 22 000 | 393 | ||||||
| 2025-07-28 | NP | AVEM - Avantis Emerging Markets Equity ETF This fund is a listed as child fund of American Century Companies Inc and if that institution has disclosed ownership in this security, then these positions will not be double counted when calculating total shares and total value | 31 117 | 0,00 | 601 | −10,18 | ||||
| 2025-08-28 | NP | CWI - SPDR(R) MSCI ACWI EX-US ETF | 19 329 | 0,35 | 346 | −13,53 | ||||
| 2025-07-23 | 13F | Shell Asset Management Co | 16 472 | 0 | ||||||
| 2025-08-07 | 13F | Marathon Trading Investment Management LLC | 0 | −100,00 | 0 | −100,00 | ||||
| 2025-08-14 | 13F | MIRAE ASSET GLOBAL ETFS HOLDINGS Ltd. | 371 120 | 21,97 | 6 656 | 5,58 | ||||
| 2025-08-13 | 13F | Quadrant Capital Group Llc | 39 438 | 64,78 | 705 | 42,42 | ||||
| 2025-08-05 | 13F | Simplex Trading, Llc | 246 121 | 4 | ||||||
| 2025-06-23 | NP | UUPIX - Ultraemerging Markets Profund Investor Class | 2 714 | 9,22 | 50 | 35,14 | ||||
| 2025-05-12 | 13F | Nordwand Advisors, LLC | 0 | −100,00 | 0 | −100,00 | ||||
| 2025-08-14 | 13F | Parallax Volatility Advisers, L.P. | Call | 150 000 | −40,00 | 2 682 | −48,22 | |||
| 2025-08-11 | 13F | HighTower Advisors, LLC | Put | 0 | −100,00 | 0 | −100,00 | |||
| 2025-07-18 | 13F | Robeco Institutional Asset Management B.V. | 0 | −100,00 | 0 | −100,00 | ||||
| 2025-06-30 | NP | PBW - Invesco WilderHill Clean Energy ETF This fund is a listed as child fund of Invesco Ltd. and if that institution has disclosed ownership in this security, then these positions will not be double counted when calculating total shares and total value | 169 941 | −49,92 | 3 161 | −38,82 | ||||
| 2025-08-12 | 13F | Virtu Financial LLC | 0 | −100,00 | 0 | −100,00 | ||||
| 2025-08-11 | 13F | Banque Cantonale Vaudoise | 0 | −100,00 | 0 | |||||
| 2025-08-28 | NP | Roundhill ETF Trust - Roundhill Humanoid Robotics ETF | 7 997 | 143 | ||||||
| 2025-07-18 | 13F | Truist Financial Corp | 16 567 | −0,05 | 296 | −13,70 | ||||
| 2025-07-29 | NP | RBB FUND, INC. - Aquarius International Fund | 2 396 | 0,00 | 46 | −9,80 | ||||
| 2025-08-15 | 13F | Equitable Holdings, Inc. | 24 950 | −7,42 | 446 | −20,07 | ||||
| 2025-08-15 | 13F | Tower Research Capital LLC (TRC) | 5 859 | −13,47 | 105 | −25,71 | ||||
| 2025-07-22 | NP | DIEFX - Destinations International Equity Fund Class I | 23 413 | 18,62 | 452 | 6,60 | ||||
| 2025-08-13 | 13F | ExodusPoint Capital Management, LP | 16 811 | 0 | ||||||
| 2025-08-14 | 13F | Atomi Financial Group, Inc. | 17 986 | 5,66 | 322 | −8,81 | ||||
| 2025-08-14 | 13F | Caption Management, LLC | Put | 200 000 | 566,67 | 3 576 | 475,85 | |||
| 2025-08-15 | 13F | Harvest Fund Management Co., Ltd | 88 500 | 0,00 | 1 | 0,00 | ||||
| 2025-08-14 | 13F | Ancora Advisors, LLC | 0 | −100,00 | 0 | −100,00 | ||||
| 2025-08-14 | 13F/A | Barclays Plc | 183 104 | 3,46 | 3 | 0,00 | ||||
| 2025-08-14 | 13F | Prelude Capital Management, Llc | 0 | −100,00 | 0 | −100,00 | ||||
| 2025-08-14 | 13F | Polar Capital Holdings Plc | 0 | −100,00 | 0 | −100,00 | ||||
| 2025-08-14 | 13F/A | Barclays Plc | Call | 0 | −100,00 | 0 | −100,00 | |||
| 2025-07-16 | 13F | St Germain D J Co Inc | 10 | 0,00 | 0 | |||||
| 2025-08-07 | 13F | Rathbone Brothers plc | 24 548 | 0,00 | 439 | −13,78 | ||||
| 2025-08-15 | 13F/A | Rakuten Securities, Inc. | 4 522 | 163,06 | 81 | 128,57 | ||||
| 2025-08-13 | 13F | Marshall Wace, Llp | 1 639 403 | 228,66 | 29 313 | 183,62 | ||||
| 2025-07-16 | 13F | Signaturefd, Llc | 23 271 | −3,94 | 416 | −16,97 | ||||
| 2025-08-12 | 13F | Atlas Capital Advisors Llc | 200 | −86,68 | 4 | −90,32 | ||||
| 2025-08-14 | 13F | Murphy & Mullick Capital Management Corp | 0 | −100,00 | 0 | |||||
| 2025-08-14 | 13F | Ameriprise Financial Inc | 127 533 | 29,41 | 2 280 | 11,71 | ||||
| 2025-04-16 | 13F/A | Azzad Asset Management Inc /adv | 0 | −100,00 | 0 | −100,00 | ||||
| 2025-08-13 | 13F | First Trust Advisors Lp | 74 082 | −10,02 | 1 325 | −22,35 | ||||
| 2025-08-14 | 13F | Jain Global LLC | 0 | −100,00 | 0 | −100,00 | ||||
| 2025-05-16 | 13F | Ctc Llc | 0 | −100,00 | 0 | −100,00 | ||||
| 2025-08-18 | 13F/A | National Bank Of Canada /fi/ | 5 133 | 25,75 | 92 | 8,33 | ||||
| 2025-08-11 | 13F | Principal Securities, Inc. | 532 | −10,14 | 10 | 50,00 | ||||
| 2025-08-14 | 13F | XY Capital Ltd | 0 | −100,00 | 0 | −100,00 | ||||
| 2025-08-14 | 13F | Cubist Systematic Strategies, LLC | Call | 29 400 | −0,34 | 526 | −14,08 | |||
| 2025-05-06 | 13F | Venturi Wealth Management, LLC | 0 | −100,00 | 0 | −100,00 | ||||
| 2025-07-03 | 13F | Garde Capital, Inc. | 1 891 | 0,00 | 34 | −15,38 | ||||
| 2025-08-25 | 13F/A | Neuberger Berman Group LLC | 0 | −100,00 | 0 | −100,00 | ||||
| 2025-08-14 | 13F | Point72 Asset Management, L.P. | Put | 100 600 | 156,63 | 1 799 | 121,43 | |||
| 2025-08-18 | 13F | Wolverine Trading, Llc | Call | 194 800 | 3 532 | |||||
| 2025-08-18 | 13F | Wolverine Trading, Llc | Put | 161 400 | 2 926 | |||||
| 2025-08-08 | 13F | Abc Arbitrage Sa | 11 908 | 213 | ||||||
| 2025-08-12 | 13F | Clear Street Markets Llc | 132 608 | 2 371 | ||||||
| 2025-08-18 | 13F | Wolverine Trading, Llc | 44 197 | 801 | ||||||
| 2025-06-27 | NP | POAGX - PRIMECAP Odyssey Aggressive Growth Fund | 2 954 210 | −13,52 | 54 948 | 5,68 | ||||
| 2025-07-24 | 13F | Us Bancorp \de\ | 72 545 | 7,13 | 1 297 | −7,56 | ||||
| 2025-08-14 | 13F | Polymer Capital Management (HK) LTD | 12 850 | 230 | ||||||
| 2025-08-14 | 13F | Point72 Asset Management, L.P. | Call | 68 600 | −81,99 | 1 227 | −84,47 | |||
| 2025-08-04 | 13F | Spire Wealth Management | 100 | 0,00 | 2 | −50,00 | ||||
| 2025-08-04 | 13F | Hantz Financial Services, Inc. | 2 107 | 732,81 | 0 | |||||
| 2025-08-07 | 13F | Profund Advisors Llc | 83 353 | −6,77 | 1 490 | −19,55 | ||||
| 2025-07-24 | 13F | Jfs Wealth Advisors, Llc | 623 | 0,00 | 11 | −8,33 | ||||
| 2025-08-14 | 13F | Point72 Europe (London) LLP | 62 700 | 1 121 | ||||||
| 2025-08-14 | 13F | Federation des caisses Desjardins du Quebec | 31 088 | 1,47 | 556 | −12,46 | ||||
| 2025-05-15 | 13F | Twinbeech Capital Lp | 0 | −100,00 | 0 | −100,00 | ||||
| 2025-08-14 | 13F | Alibaba Group Holding Ltd | 33 537 232 | −3,83 | 599 646 | −17,01 | ||||
| 2025-08-07 | 13F | Robeco Schweiz AG | 0 | −100,00 | 0 | −100,00 | ||||
| 2025-06-27 | NP | PBD - Invesco Global Clean Energy ETF This fund is a listed as child fund of Invesco Ltd. and if that institution has disclosed ownership in this security, then these positions will not be double counted when calculating total shares and total value | 39 796 | −31,20 | 740 | −15,91 | ||||
| 2025-08-28 | 13F | China Universal Asset Management Co., Ltd. | 30 000 | −6,25 | 536 | −19,16 | ||||
| 2025-08-14 | 13F | Orland Properties Ltd | 1 524 462 | 0,00 | 27 257 | −13,71 | ||||
| 2025-08-11 | 13F | Kim, Llc | 110 000 | 0,00 | 1 967 | −13,73 | ||||
| 2025-05-15 | 13F | Panagora Asset Management Inc | 0 | −100,00 | 0 | −100,00 | ||||
| 2025-08-07 | 13F | Campbell & CO Investment Adviser LLC | 0 | −100,00 | 0 | −100,00 | ||||
| 2025-08-04 | 13F | TMT General Partner Ltd | 25 533 800 | −21,98 | 228 272 | −32,67 | ||||
| 2025-08-14 | 13F | Wetherby Asset Management Inc | 68 109 | 8,58 | 1 218 | 64,24 | ||||
| 2025-07-31 | 13F | 180 Wealth Advisors, Llc | 0 | −100,00 | 0 | −100,00 | ||||
| 2025-05-15 | 13F | Laird Norton Trust Company, Llc | 0 | −100,00 | 0 | −100,00 | ||||
| 2025-07-22 | NP | GINN - Goldman Sachs Innovate Equity ETF | 0 | −100,00 | 0 | −100,00 | ||||
| 2025-08-27 | NP | RYWTX - Emerging Markets 2x Strategy Fund Class A | 3 514 | 148,34 | 63 | 113,79 | ||||
| 2025-08-13 | 13F | Invesco Ltd. | 455 387 | 5,74 | 8 142 | −8,75 | ||||
| 2025-08-14 | 13F/A | Ubs Oconnor Llc | 0 | −100,00 | 0 | −100,00 | ||||
| 2025-08-12 | 13F | BlackRock, Inc. | 1 877 855 | 10,72 | 33 576 | −4,45 | ||||
| 2025-07-11 | 13F | Kingstone Capital Partners Texas, LLC | 12 600 | 0 | ||||||
| 2025-07-22 | 13F | Valley National Advisers Inc | 0 | −100,00 | 0 | |||||
| 2025-07-15 | 13F | Public Employees Retirement System Of Ohio | 135 518 | 32,55 | 2 423 | 14,40 | ||||
| 2025-08-01 | 13F | Davy Global Fund Management Ltd | 0 | −100,00 | 0 | −100,00 | ||||
| 2025-08-06 | 13F | New Millennium Group LLC | 200 | 4 | ||||||
| 2025-05-15 | 13F | Gts Securities Llc | 0 | −100,00 | 0 | −100,00 | ||||
| 2025-07-24 | NP | FSAVX - Automotive Portfolio This fund is a listed as child fund of Fmr Llc and if that institution has disclosed ownership in this security, then these positions will not be double counted when calculating total shares and total value | 50 658 | −35,90 | 978 | −42,40 | ||||
| 2025-07-15 | 13F | Compagnie Lombard Odier SCmA | 450 | 0,00 | 8 | −11,11 | ||||
| 2025-07-31 | 13F | Curio Wealth, Llc | 15 | 1 400,00 | 0 | |||||
| 2025-08-05 | 13F | Scarborough Advisors, LLC | 46 | 1 | ||||||
| 2025-08-14 | 13F | Jane Street Group, Llc | 60 255 | −91,22 | 1 077 | −92,43 | ||||
| 2025-08-14 | 13F | LMR Partners LLP | 240 550 | 4 301 | ||||||
| 2025-07-22 | 13F | Gf Fund Management Co. Ltd. | 0 | −100,00 | 0 | −100,00 | ||||
| 2025-06-23 | NP | UGPIX - UltraChina ProFund Investor Class | 28 954 | −28,55 | 539 | −12,66 | ||||
| 2025-08-13 | 13F | Cresset Asset Management, LLC | 23 577 | 0,05 | 422 | −13,73 | ||||
| 2025-08-05 | 13F | Tsfg, Llc | 100 | 0,00 | 0 | |||||
| 2025-08-12 | 13F | Dimensional Fund Advisors Lp | 11 720 | 6,45 | 210 | −8,33 | ||||
| 2025-08-14 | 13F | Banque Transatlantique SA | 0 | −100,00 | 0 | −100,00 | ||||
| 2025-08-08 | 13F | SG Americas Securities, LLC | 340 139 | 43,12 | 6 | 50,00 | ||||
| 2025-08-27 | NP | CGRO - CoreValues Alpha Greater China Growth ETF | 8 507 | 15,38 | 152 | 0,00 | ||||
| 2025-07-22 | 13F | IMC-Chicago, LLC | 58 098 | 1 039 | ||||||
| 2025-08-08 | 13F | Larson Financial Group LLC | 0 | −100,00 | 0 | −100,00 | ||||
| 2025-08-14 | 13F | Bridgefront Capital, LLC | 19 492 | 49,06 | 349 | 28,89 | ||||
| 2025-07-22 | 13F | LGT Fund Management Co Ltd. | 197 700 | 3 535 | ||||||
| 2025-08-07 | 13F | Zurcher Kantonalbank (Zurich Cantonalbank) | 0 | −100,00 | 0 | −100,00 | ||||
| 2025-08-08 | 13F | Central Asset Investments & Management Holdings (HK) Ltd | 0 | −100,00 | 0 | −100,00 | ||||
| 2025-08-07 | 13F | Winch Advisory Services, LLC | 28 | 0,00 | 1 | |||||
| 2025-08-12 | 13F | Rhumbline Advisers | 4 843 | −2,87 | 87 | −16,50 | ||||
| 2025-08-14 | 13F | Two Sigma Advisers, Lp | 212 900 | 3 807 | ||||||
| 2025-08-14 | 13F | Twenty Acre Capital LP | 397 400 | −15,32 | 7 106 | 28,09 | ||||
| 2025-07-31 | 13F | Cambridge Investment Research Advisors, Inc. | 0 | −100,00 | 0 | |||||
| 2025-05-02 | 13F | Cable Hill Partners, LLC | 16 177 | 301 | ||||||
| 2025-08-12 | 13F | Jpmorgan Chase & Co | 1 830 105 | 41,51 | 32 722 | 22,11 | ||||
| 2025-08-14 | 13F | Voloridge Investment Management, Llc | 576 540 | −76,40 | 10 309 | −79,64 | ||||
| 2025-08-14 | 13F | State Street Corp | 598 292 | 26,25 | 10 697 | 8,95 | ||||
| 2025-08-14 | 13F | Gordian Capital Singapore Pte Ltd | 0 | −100,00 | 0 | −100,00 | ||||
| 2025-08-26 | NP | Forethought Variable Insurance Trust - Global Atlantic BlackRock Disciplined Core Portfolio Class I Shares | 4 284 | 0,00 | 77 | −13,64 | ||||
| 2025-07-08 | 13F | Quintet Private Bank (Europe) S.A. | 200 | 0,00 | 4 | −25,00 | ||||
| 2025-08-14 | 13F | Qube Research & Technologies Ltd | 370 919 | −46,21 | 6 632 | −53,58 | ||||
| 2025-08-07 | 13F | Vise Technologies, Inc. | 26 476 | 120,21 | 473 | 233,10 | ||||
| 2025-08-13 | 13F | EverSource Wealth Advisors, LLC | 2 305 | 20,43 | 41 | 5,13 | ||||
| 2025-08-05 | 13F | Key FInancial Inc | 74 | 0,00 | 1 | 0,00 | ||||
| 2025-08-12 | 13F | Strategic Advisors LLC | 44 291 | 792 | ||||||
| 2025-08-06 | 13F | Savant Capital, LLC | 15 570 | 1,30 | 278 | −12,58 | ||||
| 2025-08-26 | NP | NXTE - AXS Green Alpha ETF | 29 794 | 0,00 | 533 | −13,78 | ||||
| 2025-07-28 | 13F | Bayforest Capital Ltd | 917 | −59,83 | 16 | −65,96 | ||||
| 2025-07-10 | 13F | Exchange Traded Concepts, Llc | 643 887 | 11 513 | ||||||
| 2025-07-17 | 13F | Greenleaf Trust | 16 235 | 1,04 | 290 | −12,65 | ||||
| 2025-07-30 | NP | APIE - ActivePassive International Equity ETF | 38 800 | 50,76 | 749 | 35,44 | ||||
| 2025-08-14 | 13F/A | Skopos Labs, Inc. | 7 237 | 70,24 | 129 | 46,59 | ||||
| 2025-05-02 | 13F | Cullen/frost Bankers, Inc. | 0 | −100,00 | 0 | −100,00 | ||||
| 2025-05-14 | 13F | Hsbc Holdings Plc | Call | 0 | −100,00 | 0 | −100,00 | |||
| 2025-05-05 | 13F | Creekmur Asset Management LLC | 0 | −100,00 | 0 | −100,00 | ||||
| 2025-07-18 | 13F | PFG Investments, LLC | 14 473 | 16,03 | 259 | 0,00 | ||||
| 2025-07-24 | 13F | PDS Planning, Inc | 10 343 | −2,02 | 185 | −15,60 | ||||
| 2025-05-12 | 13F | AI-Squared Management Ltd | 0 | −100,00 | 0 | −100,00 | ||||
| 2025-06-30 | NP | TRFM - AAM Transformers ETF | 6 247 | −58,97 | 116 | −49,78 | ||||
| 2025-08-08 | 13F | KBC Group NV | 32 312 | 0,00 | 1 | |||||
| 2025-08-13 | 13F | Natixis | 6 412 | 77,37 | 115 | 52,00 | ||||
| 2025-07-25 | 13F | Cwm, Llc | 2 536 | −9,46 | 0 | |||||
| 2025-08-28 | NP | HAIL - SPDR S&P Kensho Smart Mobility ETF This fund is a listed as child fund of State Street Corp and if that institution has disclosed ownership in this security, then these positions will not be double counted when calculating total shares and total value | 15 653 | −45,74 | 280 | −53,27 | ||||
| 2025-08-13 | 13F | Quantbot Technologies LP | 25 949 | −26,51 | 464 | −36,66 | ||||
| 2025-08-14 | 13F | Hancock Prospecting Pty Ltd | 7 000 | 0,00 | 125 | −13,79 | ||||
| 2025-08-13 | 13F | Centiva Capital, LP | 0 | −100,00 | 0 | −100,00 | ||||
| 2025-05-14 | 13F | Rafferty Asset Management, LLC | 0 | −100,00 | 0 | −100,00 | ||||
| 2025-08-05 | 13F | NewSquare Capital LLC | 0 | −100,00 | 0 | |||||
| 2025-08-13 | 13F | Mackenzie Financial Corp | 114 473 | −6,91 | 2 047 | −19,70 | ||||
| 2025-08-08 | 13F | Creative Planning | 39 979 | −5,26 | 715 | −18,31 | ||||
| 2025-08-14 | 13F | Polymer Capital Management (US) LLC | 10 748 | 192 | ||||||
| 2025-07-31 | 13F | CNB Bank | 100 | 0,00 | 2 | −50,00 | ||||
| 2025-07-28 | NP | NSI - National Security Emerging Markets Index ETF | 3 050 | 38,64 | 59 | 23,40 | ||||
| 2025-07-11 | 13F | Global X Japan Co., Ltd. | 941 | 0,00 | 17 | −15,79 | ||||
| 2025-08-13 | 13F | CMT Capital Markets Trading GmbH | 30 000 | 1 | ||||||
| 2025-08-28 | NP | SPGM - SPDR(R) Portfolio MSCI Global Stock Market ETF | 60 | 0,00 | 1 | 0,00 | ||||
| 2025-08-15 | 13F | Kestra Advisory Services, LLC | 19 418 | 75,68 | 347 | 51,53 | ||||
| 2025-08-11 | 13F | Brown Brothers Harriman & Co | 201 | 4 | ||||||
| 2025-08-27 | 13F/A | Squarepoint Ops LLC | 220 089 | 3 935 | ||||||
| 2025-07-08 | 13F | Parallel Advisors, LLC | 8 745 | −11,99 | 156 | −23,90 | ||||
| 2025-07-14 | 13F | Abound Wealth Management | 6 | 0,00 | 0 | |||||
| 2025-08-06 | 13F | Golden State Wealth Management, LLC | 315 | 0,00 | 6 | −16,67 | ||||
| 2025-08-12 | 13F | CIBC Private Wealth Group, LLC | 2 000 | 36 | ||||||
| 2025-08-05 | 13F | Bank Of Montreal /can/ | 61 546 | 2,32 | 1 100 | −11,72 | ||||
| 2025-08-14 | 13F | D. E. Shaw & Co., Inc. | Call | 916 900 | 51,05 | 16 394 | 30,35 | |||
| 2025-08-27 | 13F/A | Squarepoint Ops LLC | Call | 293 000 | −68,62 | 5 239 | −72,93 | |||
| 2025-07-14 | 13F | UMA Financial Services, Inc. | 60 | 1 | ||||||
| 2025-07-25 | 13F | Sequoia Financial Advisors, LLC | 14 426 | 2,08 | 258 | −11,99 | ||||
| 2025-08-14 | 13F | D. E. Shaw & Co., Inc. | Put | 140 500 | −61,05 | 2 512 | −66,39 | |||
| 2025-08-27 | 13F/A | Squarepoint Ops LLC | Put | 182 200 | 81,66 | 3 258 | 56,74 | |||
| 2025-08-14 | 13F | D. E. Shaw & Co., Inc. | 4 847 640 | −26,90 | 86 676 | −36,92 | ||||
| 2025-08-12 | 13F | LPL Financial LLC | 76 833 | 5,14 | 1 374 | −9,31 | ||||
| 2025-08-28 | NP | Acap Strategic Fund | Short | −1 730 669 | −12,67 | −30 944 | −24,64 | |||
| 2025-08-11 | 13F | Primecap Management Co/ca/ | 14 423 077 | 0,27 | 257 885 | −13,47 | ||||
| 2025-08-19 | 13F | Marex Group plc | 41 771 | 747 | ||||||
| 2025-08-11 | 13F | TD Waterhouse Canada Inc. | 3 080 | 0,00 | 56 | −12,50 | ||||
| 2025-08-12 | 13F | O'shaughnessy Asset Management, Llc | 36 291 | 9,21 | 649 | −5,81 | ||||
| 2025-08-18 | NP | Advantage Advisers Xanthus Fund, L.l.c. | Short | −501 718 | −11,26 | −8 971 | −23,42 | |||
| 2025-06-26 | NP | SNTKX - Steward International Enhanced Index Fund Class A | 9 078 | 169 | ||||||
| 2025-07-30 | NP | DRIV - Global X Autonomous & Electric Vehicles ETF This fund is a listed as child fund of Mirae Asset Global Investments Co., Ltd. and if that institution has disclosed ownership in this security, then these positions will not be double counted when calculating total shares and total value | 286 409 | −8,75 | 5 531 | −18,01 | ||||
| 2025-05-14 | 13F | Quinn Opportunity Partners LLC | 0 | −100,00 | 0 | −100,00 | ||||
| 2025-08-13 | 13F | Arrowpoint Investment Partners (Singapore) Pte. Ltd. | Call | 500 000 | 8 940 | |||||
| 2025-08-08 | 13F | Pnc Financial Services Group, Inc. | 14 601 | 14,61 | 261 | −0,76 | ||||
| 2025-07-30 | 13F | FNY Investment Advisers, LLC | Put | 0 | −100,00 | 0 | ||||
| 2025-08-29 | NP | NTSE - WisdomTree Emerging Markets Efficient Core Fund N/A | 611 | 0,00 | 11 | −16,67 | ||||
| 2025-08-13 | 13F | Truvestments Capital Llc | 130 | 0,00 | 2 | 0,00 | ||||
| 2025-08-14 | 13F | Citadel Advisors Llc | Call | 1 225 900 | −10,54 | 21 919 | −22,80 | |||
| 2025-08-27 | NP | BEXFX - Baron Emerging Markets Fund | 400 063 | −39,08 | 7 153 | −47,43 | ||||
| 2025-08-12 | 13F | Advisors Asset Management, Inc. | 58 894 | −3,07 | 1 053 | −16,30 | ||||
| 2025-08-28 | NP | BATT - Amplify Advanced Battery Metals and Materials ETF | 42 155 | −19,17 | 754 | −30,28 | ||||
| 2025-04-09 | 13F | Green Alpha Advisors, LLC | 0 | −100,00 | 0 | −100,00 | ||||
| 2025-07-25 | 13F | JustInvest LLC | 67 826 | 10,56 | 1 213 | −4,64 | ||||
| 2025-08-01 | 13F | Centerpoint Advisors, LLC | 0 | −100,00 | 0 | |||||
| 2025-08-07 | 13F | Investment Management Corp /va/ /adv | 235 | 0,00 | 4 | 0,00 | ||||
| 2025-08-14 | 13F | Engineers Gate Manager LP | 23 579 | −44,18 | 422 | −51,89 | ||||
| 2025-08-01 | 13F | Bank of Jackson Hole Trust | 5 | 0,00 | 0 | |||||
| 2025-08-13 | 13F | Capital Markets Trading UK LLP | 15 149 | 0 | ||||||
| 2025-08-14 | 13F | Massar Capital Management, LP | 38 300 | 685 | ||||||
| 2025-08-14 | 13F | Jane Street Group, Llc | Put | 1 375 700 | 26,69 | 24 598 | 9,32 | |||
| 2025-08-14 | 13F | Hrt Financial Lp | 0 | −100,00 | 0 | −100,00 | ||||
| 2025-08-07 | 13F | Connor, Clark & Lunn Investment Management Ltd. | 2 056 572 | 56,63 | 36 772 | 35,16 | ||||
| 2025-08-07 | 13F | Parkside Financial Bank & Trust | 58 | 1 | ||||||
| 2025-08-13 | 13F | Walleye Capital LLC | Call | 61 800 | −75,45 | 1 105 | −78,83 | |||
| 2025-08-13 | 13F | Walleye Capital LLC | Put | 38 900 | −62,92 | 696 | −68,02 | |||
| 2025-08-07 | 13F | Allworth Financial LP | 1 413 | 2,54 | 25 | −10,71 | ||||
| 2025-08-14 | 13F | Jane Street Group, Llc | Call | 1 428 800 | −28,68 | 25 547 | −38,46 | |||
| 2025-05-05 | 13F | Lindbrook Capital, Llc | 3 520 | 4,08 | 73 | 84,62 | ||||
| 2025-08-14 | 13F | Quantitative Investment Management, LLC | 0 | −100,00 | 0 | |||||
| 2025-05-14 | 13F | Group One Trading, L.p. | 0 | −100,00 | 0 | −100,00 | ||||
| 2025-08-13 | 13F | Walleye Capital LLC | 145 285 | −71,69 | 2 598 | −75,58 | ||||
| 2025-07-22 | 13F | MBL Wealth, LLC | 19 884 | 0,00 | 356 | −13,63 | ||||
| 2025-08-26 | NP | FTHI - First Trust BuyWrite Income ETF This fund is a listed as child fund of First Trust Advisors Lp and if that institution has disclosed ownership in this security, then these positions will not be double counted when calculating total shares and total value | 60 101 | −3,30 | 1 075 | −16,55 | ||||
| 2025-08-13 | 13F | Jones Financial Companies Lllp | 5 090 | 153,36 | 92 | 135,90 | ||||
| 2025-07-31 | 13F | Nisa Investment Advisors, Llc | 300 | 0,00 | 5 | −16,67 | ||||
| 2025-08-14 | 13F | Tudor Investment Corp Et Al | Call | 0 | −100,00 | 0 | −100,00 | |||
| 2025-08-14 | 13F | Tudor Investment Corp Et Al | 0 | −100,00 | 0 | −100,00 | ||||
| 2025-08-14 | 13F | CoreCap Advisors, LLC | 3 655 | −21,48 | 65 | −32,29 | ||||
| 2025-07-30 | 13F | FNY Investment Advisers, LLC | 10 000 | 0 | ||||||
| 2025-08-12 | 13F | XTX Topco Ltd | 24 389 | 436 | ||||||
| 2025-08-18 | 13F/A | Nomura Holdings Inc | Put | 0 | −100,00 | 0 | −100,00 | |||
| 2025-08-14 | 13F | Mariner, LLC | 68 233 | −3,72 | 1 220 | −16,84 | ||||
| 2025-07-22 | 13F | Gsa Capital Partners Llp | 46 954 | 108,02 | 1 | |||||
| 2025-08-14 | 13F | Van Eck Associates Corp | 208 876 | −13,34 | 4 | −25,00 | ||||
| 2025-08-12 | 13F | Steward Partners Investment Advisory, Llc | 1 645 | −0,30 | 29 | −14,71 | ||||
| 2025-08-13 | 13F | Groupe la Francaise | 150 | 3 | ||||||
| 2025-08-13 | 13F | NINE MASTS CAPITAL Ltd | 76 250 | 175,77 | 1 372 | 144,82 | ||||
| 2025-08-18 | 13F/A | Nomura Holdings Inc | 0 | −100,00 | 0 | −100,00 | ||||
| 2025-08-13 | 13F | Hsbc Holdings Plc | 228 099 | 48,37 | 4 084 | 28,15 | ||||
| 2025-08-14 | 13F | Bank Of America Corp /de/ | 4 096 004 | −13,00 | 73 237 | −24,93 | ||||
| 2025-08-12 | 13F | Pathstone Holdings, LLC | 35 888 | −2,30 | 642 | −15,77 | ||||
| 2025-08-26 | NP | Profunds - Profund Vp Asia 30 | 33 011 | −7,23 | 590 | −19,95 | ||||
| 2025-08-12 | 13F | Coldstream Capital Management Inc | 17 017 | 2 234,29 | 304 | 1 926,67 | ||||
| 2025-08-14 | 13F | Fmr Llc | 84 412 | −22,64 | 1 509 | −33,23 | ||||
| 2025-04-29 | 13F | Harel Insurance Investments & Financial Services Ltd. | 0 | −100,00 | 0 | |||||
| 2025-08-14 | 13F | Headlands Technologies LLC | 642 | 11 | ||||||
| 2025-04-21 | 13F | Nelson, Van Denburg & Campbell Wealth Management Group, LLC | 0 | −100,00 | 0 | −100,00 | ||||
| 2025-06-26 | NP | CCSO - Carbon Collective Climate Solutions U.S. Equity ETF | 33 563 | 45,38 | 624 | 77,78 | ||||
| 2025-08-14 | 13F | Bnp Paribas Arbitrage, Sa | 3 180 515 | −40,07 | 56 868 | −48,28 | ||||
| 2025-08-13 | 13F | Northern Trust Corp | 151 358 | 1,64 | 2 706 | −12,29 | ||||
| 2025-08-25 | NP | CARZ - First Trust NASDAQ Global Auto Index Fund This fund is a listed as child fund of First Trust Advisors Lp and if that institution has disclosed ownership in this security, then these positions will not be double counted when calculating total shares and total value | 6 807 | −49,55 | 122 | −56,63 | ||||
| 2025-08-12 | 13F | American Century Companies Inc | 31 985 | 0,40 | 572 | −13,48 | ||||
| 2025-09-04 | 13F/A | Advisor Group Holdings, Inc. | 15 528 | 4,47 | 278 | −9,77 | ||||
| 2025-08-13 | 13F | Renaissance Technologies Llc | 2 100 367 | −23,33 | 37 555 | −33,84 | ||||
| 2025-08-14 | 13F | GWM Advisors LLC | 160 | 3 | ||||||
| 2025-07-15 | 13F | MCF Advisors LLC | 4 606 | 0,00 | 82 | −13,68 | ||||
| 2025-08-14 | 13F | Vident Advisory, LLC | 47 899 | −33,40 | 856 | −42,55 | ||||
| 2025-07-30 | 13F | Financial Perspectives, Inc | 4 399 | 0,05 | 79 | −14,29 | ||||
| 2025-08-12 | 13F | Legal & General Group Plc | 506 924 | 418,72 | 9 063 | 347,33 | ||||
| 2025-07-11 | 13F | Farther Finance Advisors, LLC | 1 016 | −21,30 | 18 | −33,33 | ||||
| 2025-07-30 | 13F | DekaBank Deutsche Girozentrale | 1 100 000 | 0,00 | 20 | −13,64 | ||||
| 2025-08-14 | 13F | J. Goldman & Co LP | 13 600 | 243 | ||||||
| 2025-08-13 | 13F | Jump Financial, LLC | 17 077 | −96,22 | 305 | −96,74 | ||||
| 2025-08-12 | 13F | Deutsche Bank Ag\ | 99 144 | −5,20 | 1 773 | −18,19 | ||||
| 2025-08-13 | 13F | Northwestern Mutual Wealth Management Co | 898 | 105,49 | 16 | 77,78 | ||||
| 2025-08-14 | 13F | Peak6 Llc | Put | 1 020 400 | 329,10 | 18 245 | 270,29 | |||
| 2025-07-23 | 13F | Triasima Portfolio Management inc. | 236 865 | 82,11 | 4 235 | 57,14 | ||||
| 2025-08-14 | 13F | Peak6 Llc | 4 232 | 76 | ||||||
| 2025-07-21 | 13F | Mirae Asset Global Investments Co., Ltd. | 75 470 | 2,93 | 1 349 | −6,58 | ||||
| 2025-08-14 | 13F | Sig Brokerage, Lp | Call | 24 000 | 0,00 | 429 | −13,68 | |||
| 2025-08-14 | 13F | Verition Fund Management LLC | 162 310 | 355,65 | 2 902 | 293,22 | ||||
| 2025-06-26 | NP | DFEM - Dimensional Emerging Markets Core Equity 2 ETF | 3 000 | 0,00 | 56 | 22,22 | ||||
| 2025-08-06 | 13F | Commonwealth Equity Services, Llc | 0 | −100,00 | 0 | |||||
| 2025-08-14 | 13F | Oasis Management Co Ltd. | 0 | −100,00 | 0 | −100,00 | ||||
| 2025-08-04 | 13F | Creative Financial Designs Inc /adv | 700 | 0,00 | 13 | −14,29 | ||||
| 2025-08-11 | 13F | Citigroup Inc | Put | 2 300 000 | 79,16 | 41 124 | 54,60 | |||
| 2025-08-12 | 13F | Proequities, Inc. | 0 | 0 | ||||||
| 2025-07-28 | NP | AVSE - Avantis Responsible Emerging Markets Equity ETF | 796 | 13,39 | 15 | 0,00 | ||||
| 2025-07-23 | 13F | High Note Wealth, LLC | 0 | −100,00 | 0 | |||||
| 2025-08-14 | 13F | Raymond James Financial Inc | 26 982 | 139,71 | 482 | 106,87 | ||||
| 2025-06-27 | NP | EVAV - Direxion Daily Electric and Autonomous Vehicles Bull 2X Shares | 6 252 | −74,34 | 116 | −68,65 | ||||
| 2025-07-29 | 13F | JTC Employer Solutions Trusteee Ltd | 1 271 | 0,00 | 0 | |||||
| 2025-08-27 | NP | CGAEX - Calvert Global Energy Solutions Fund Class A | 35 862 | 0,46 | 641 | −13,26 | ||||
| 2025-05-15 | 13F | FSA Wealth Management LLC | 0 | −100,00 | 0 | −100,00 | ||||
| 2025-08-11 | 13F | Primavera Capital Management Ltd | 3 306 567 | 0,00 | 59 121 | −13,71 | ||||
| 2025-07-14 | 13F | AdvisorNet Financial, Inc | 2 035 | −48,84 | 36 | −56,10 | ||||
| 2025-08-14 | 13F | Barometer Capital Management Inc. | 46 600 | 33,14 | 833 | 14,90 | ||||
| 2025-08-11 | 13F | Citigroup Inc | 146 850 | 101,37 | 2 626 | 73,73 | ||||
| 2025-05-16 | 13F | Ctc Llc | Call | 0 | −100,00 | 0 | −100,00 | |||
| 2025-08-11 | 13F | Strategic Wealth Partners, Ltd. | 40 | 1 | ||||||
| 2025-05-15 | 13F | CAPROCK Group, Inc. | 10 505 | 218 | ||||||
| 2025-07-16 | 13F | Highline Wealth Partners Llc | 167 | 72,16 | 3 | 0,00 | ||||
| 2025-05-14 | 13F | Capital Fund Management S.a. | 0 | −100,00 | 0 | −100,00 | ||||
| 2025-08-13 | 13F | Walleye Trading LLC | Call | 155 700 | −51,40 | 2 784 | −58,07 | |||
| 2025-08-14 | 13F | Wells Fargo & Company/mn | 3 967 | −26,07 | 71 | −36,94 | ||||
| 2025-08-13 | 13F | Walleye Trading LLC | Put | 485 000 | 100,83 | 8 672 | 73,32 | |||
| 2025-08-13 | 13F | Walleye Trading LLC | 47 539 | 850 | ||||||
| 2025-07-17 | 13F | Clean Yield Group | 0 | −100,00 | 0 | −100,00 | ||||
| 2025-06-26 | NP | DFSE - Dimensional Emerging Markets Sustainability Core 1 ETF | 50 | 1 | ||||||
| 2025-08-14 | 13F | Goldman Sachs Group Inc | 5 003 342 | 309,88 | 89 460 | 253,70 | ||||
| 2025-08-14 | 13F | Toroso Investments, LLC | 91 770 | 3,59 | 1 641 | −10,63 | ||||
| 2025-08-14 | 13F | Parallax Volatility Advisers, L.P. | Put | 0 | −100,00 | 0 | −100,00 | |||
| 2025-08-13 | 13F | HAP Trading, LLC | Call | 32 500 | −74,39 | 31 | −73,68 | |||
| 2025-07-15 | 13F | Ballentine Partners, LLC | 24 862 | 9,05 | 445 | −5,93 | ||||
| 2025-08-14 | 13F | Bamco Inc /ny/ | 439 981 | −48,42 | 7 867 | −55,49 | ||||
| 2025-08-13 | 13F | Worm Capital, Llc | 213 655 | 3 820 | ||||||
| 2025-08-04 | 13F | Assetmark, Inc | 66 | 1 | ||||||
| 2025-08-12 | 13F | Trexquant Investment LP | 0 | −100,00 | 0 | −100,00 | ||||
| 2025-08-13 | 13F | Knollwood Investment Advisory, LLC | 14 350 | 0,00 | 257 | −13,80 | ||||
| 2025-08-14 | 13F | Caption Management, LLC | Call | 0 | −100,00 | 0 | −100,00 | |||
| 2025-08-14 | 13F | Parallax Volatility Advisers, L.P. | 0 | −100,00 | 0 | −100,00 | ||||
| 2025-06-27 | NP | PGJ - Invesco Golden Dragon China ETF This fund is a listed as child fund of Invesco Ltd. and if that institution has disclosed ownership in this security, then these positions will not be double counted when calculating total shares and total value | 210 452 | 7,48 | 3 914 | 31,34 | ||||
| 2025-07-09 | 13F | Aaron Wealth Advisors LLC | 0 | −100,00 | 0 | −100,00 | ||||
| 2025-08-14 | 13F | Quantinno Capital Management LP | 66 856 | 20,97 | 1 195 | 4,37 | ||||
| 2025-08-14 | 13F | Macquarie Group Ltd | 20 287 | 0,00 | 363 | −13,81 | ||||
| 2025-08-14 | 13F | Two Sigma Securities, Llc | 11 754 | 210 | ||||||
| 2025-04-15 | 13F | Fifth Third Bancorp | 0 | −100,00 | 0 | −100,00 | ||||
| 2025-08-13 | 13F | West Family Investments, Inc. | 12 286 | 220 | ||||||
| 2025-08-14 | 13F | Temasek Holdings (Private) Ltd | 1 194 538 | 21 358 | ||||||
| 2025-06-24 | NP | EMRSX - JPMorgan Emerging Markets Research Enhanced Equity Fund Class R6 | 0 | −100,00 | 0 | −100,00 | ||||
| 2025-07-30 | 13F | Ethic Inc. | 77 604 | 6,78 | 1 407 | −7,68 | ||||
| 2025-08-14 | 13F | Citadel Advisors Llc | 643 765 | 67,40 | 11 511 | 44,45 | ||||
| 2025-08-14 | 13F | Citadel Advisors Llc | Put | 2 342 000 | −12,06 | 41 875 | −24,12 | |||
| 2025-08-12 | 13F | Mizuho Securities Co. Ltd. | 34 023 | 608 | ||||||
| 2025-08-29 | NP | MPLAX - Praxis International Index Fund Class A | 27 625 | 0,00 | 494 | −13,81 | ||||
| 2025-08-13 | 13F | HAP Trading, LLC | Put | 0 | −100,00 | 0 | −100,00 | |||
| 2025-08-27 | NP | CEFIX - Calvert Emerging Markets Advancement Fund Class I | 12 493 | 0,00 | 223 | −13,57 | ||||
| 2025-08-26 | NP | Profunds - Profund Vp Emerging Markets | 11 275 | 11,39 | 202 | −3,83 | ||||
| 2025-08-14 | 13F | Bayesian Capital Management, LP | 33 300 | 595 | ||||||
| 2025-08-11 | 13F | Nations Financial Group Inc, /ia/ /adv | 55 722 | 55,77 | 996 | 34,41 | ||||
| 2025-05-14 | 13F/A | Norges Bank | 0 | −100,00 | 0 | −100,00 | ||||
| 2025-07-15 | 13F | Maseco Llp | 299 | 5 | ||||||
| 2025-08-11 | 13F | Bell Investment Advisors, Inc | 329 | 0,00 | 6 | −16,67 | ||||
| 2025-08-26 | NP | EHLS - Even Herd Long Short ETF | 0 | −100,00 | 0 | −100,00 | ||||
| 2025-04-25 | 13F | Morton Brown Family Wealth, LLC | 0 | −100,00 | 0 | |||||
| 2025-07-14 | 13F | Ridgewood Investments LLC | 116 | 0,00 | 2 | 0,00 | ||||
| 2025-08-14 | 13F | Susquehanna International Group, Llp | Put | 4 167 700 | 38,48 | 74 518 | 19,50 | |||
| 2025-08-14 | 13F | Susquehanna International Group, Llp | 1 740 163 | 175,92 | 31 114 | 138,11 | ||||
| 2025-07-24 | 13F | Ronald Blue Trust, Inc. | 562 | −60,56 | 10 | −65,52 | ||||
| 2025-07-31 | 13F | Washington Trust Advisors, Inc. | 150 | 0,00 | 3 | −33,33 | ||||
| 2025-08-13 | 13F | Russell Investments Group, Ltd. | 200 | 4 | ||||||
| 2025-08-14 | 13F | Susquehanna International Group, Llp | Call | 2 165 800 | −62,20 | 38 725 | −67,38 | |||
| 2025-08-06 | 13F | Fox Run Management, L.l.c. | 22 300 | 399 | ||||||
| 2025-08-14 | 13F | Royal Bank Of Canada | 15 763 | −33,37 | 282 | −42,45 | ||||
| 2025-08-14 | 13F | Lazard Asset Management Llc | 162 | 0,00 | 0 | |||||
| 2025-08-08 | 13F | SBI Securities Co., Ltd. | 17 613 | 3,86 | 315 | −10,54 | ||||
| 2025-08-28 | NP | KOMP - SPDR S&P Kensho New Economies Composite ETF This fund is a listed as child fund of State Street Corp and if that institution has disclosed ownership in this security, then these positions will not be double counted when calculating total shares and total value | 351 743 | 64,85 | 6 289 | 42,25 | ||||
| 2025-08-14 | 13F | UBS Group AG | Put | 150 000 | −86,96 | 2 682 | −88,74 | |||
| 2025-08-08 | 13F | Crossmark Global Holdings, Inc. | 14 559 | 6,28 | 260 | −8,13 | ||||
| 2025-08-14 | 13F | UBS Group AG | 8 332 084 | 12,23 | 148 978 | −3,15 | ||||
| 2025-05-15 | 13F | Optiver Holding B.V. | 0 | −100,00 | 0 | −100,00 | ||||
| 2025-08-14 | 13F | UBS Group AG | Call | 3 000 076 | 72,93 | 53 641 | 49,22 | |||
| 2025-08-15 | 13F | Morgan Stanley | 9 183 974 | −14,57 | 164 209 | −26,28 | ||||
| 2025-08-21 | NP | SMOG - VanEck Vectors Low Carbon Energy ETF | 208 876 | −13,34 | 3 735 | −25,23 | ||||
| 2025-08-14 | 13F | Peak6 Llc | Call | 1 024 900 | −44,57 | 18 325 | −52,17 | |||
| 2025-07-24 | 13F | IFP Advisors, Inc | 71 | −29,70 | 1 | −50,00 | ||||
| 2025-08-11 | 13F | HighTower Advisors, LLC | 14 601 | 0,63 | 261 | −13,00 | ||||
| 2025-08-14 | 13F | Ghisallo Capital Management LLC | 500 000 | 8 940 | ||||||
| 2025-08-01 | 13F | Y-Intercept (Hong Kong) Ltd | 0 | −100,00 | 0 | −100,00 | ||||
| 2025-08-07 | 13F | Sierra Ocean, Llc | 94 | 30,56 | 2 | 0,00 |